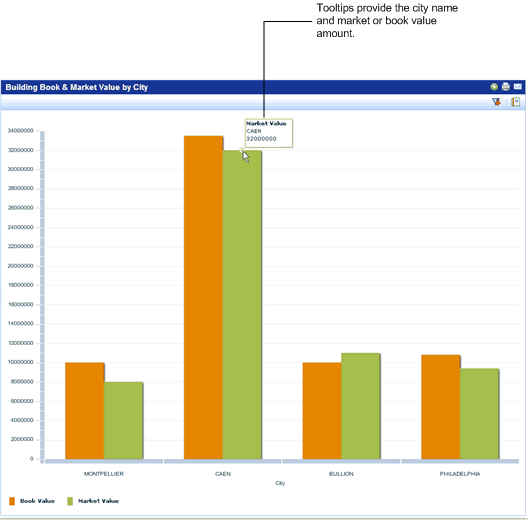
The Book & Market Value by... Chart provides an overview of the portfolio market value and book value grouped by geographic location. For buildings, you can generate the chart by building; for land or structures, you can generate the chart by property. This enables you to see data for each portfolio item.
The Market Value is the sum of the market value entered for either buildings, structures, or land in the selected geographic location; the Book Value is the sum of all book values for either buildings, structures, or land in the selected geographic location. You can enter this data using the Add/Edit wizard, or through ARCHIBUS for Windows.
You can filter the chart by geographic location. See Filtering KPI Charts.
You can click on a bar or line in the graph to drill down to see the details for the data for that item. For example, if you click on the line for a city in a chart showing buildings grouped by city, you see a chart with data for only that city. You can drill down to view a single portfolio item (building, structure, or land). See Drilldown for KPI Charts Grouped by Geography.
You can generate this chart for buildings, structures, or land from the Process Navigator (Portfolio Management/Buildings, Structures, or Land processes). By default, the Book & Market Value by City Chart is available on the Buildings, Structures, and Land Dashboards.
You can generate the chart as a report. See Generating KPI Charts as Reports.
The Book Value versus Market Value by...Chart helps you look for profit opportunities in your current portfolio.
The following chart shows the book value compared to the market value by city. When you mouse over a bar, the market or book value amount is shown.
