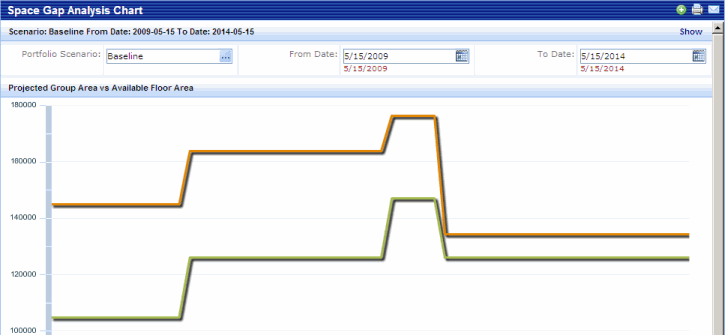
The Space Gap Analysis chart projects the space allocated to groups across all buildings, and compares it against the available floor space in each time period. This chart can illustrate the periods when the projected space allocation exceeds the amount of available space (over-allocation) and the periods when the allocated group space is less than the available space (under-allocation.)
Note that the chart uses the groups you have defined and the groups' start and end dates as the basis for the projection. You add groups and their start and end dates from the Allocate Groups tab of the Portfolio Forecast Wizard.
If during a forecast time period you have a vacant but available floor, you need to incorporate that floor into the forecast by adding an empty group to the floor. You can add empty groups from the Allocate Groups tab of the Portfolio Forecast Wizard. See Adding Empty Groups.
If you have a floor that is subleased and therefore not available, you need to make sure that you do not assign any groups to the floor during the sublease period.
You can generate a different chart for each scenario by selecting a scenario from the Portfolio Scenario field at the top of the screen. You can also set the time period for the chart by setting the From and To Dates. Click Show to generate the chart using your selections.
The below screen shot shows the Space Gap Analysis Chart:
See Also