Open topic with navigation
Environmental & Risk Management / Green Building / Carbon Footprint - Review
Footprint Summary, Deleted Building Footprint Summary, and Footprint Summary Chart
The Carbon Footprint - Review process includes the following reports that summarize information for all emission scopes for a single location, scenario, and calculation year.
- Footprint Summary: Enables you to review totals for all emission sources by emission scope for a single building or site, calculation year, and footprint scenario. The summary includes the totals for each emission scope (, , , and ), and the breakdown for each source category for that scope. When you need to review emissions for a single site or building, this report provides direct access to that data.
- Deleted Buildings Footprint Summary: Enables you to review totals for all emission sources by emission scope for a single deleted building, calculation year, and footprint scenario. Deleted buildings are buildings for which you at one point defined carbon footprint data, and then deleted that building's record from the building's table, perhaps because you no longer own or manage the building. The best practice for Real Estate Portfolio Management is to mark buildings as Disposed (if you owned the building) or Lease Inactive (if you leased the building), rather than deleting the building. However, if you do delete buildings, the standard Building Footprint Summary report does not provide a means to retrieve data for these buildings, so the Deleted Building Footprint Summary report provides that access.
- Footprint Summary Chart: Presents a chart showing the breakdown of emissions by scope , , , and with the ability to drill down to see the source category data for each scope. This enables you to determine the emission scopes that are contributing to overall emissions. Use this report when you want to chart the breakdown of emissions for a single site or building, need access to source category data, and want to export this data for sharing offline, or for manipulation in a spreadsheet tool.
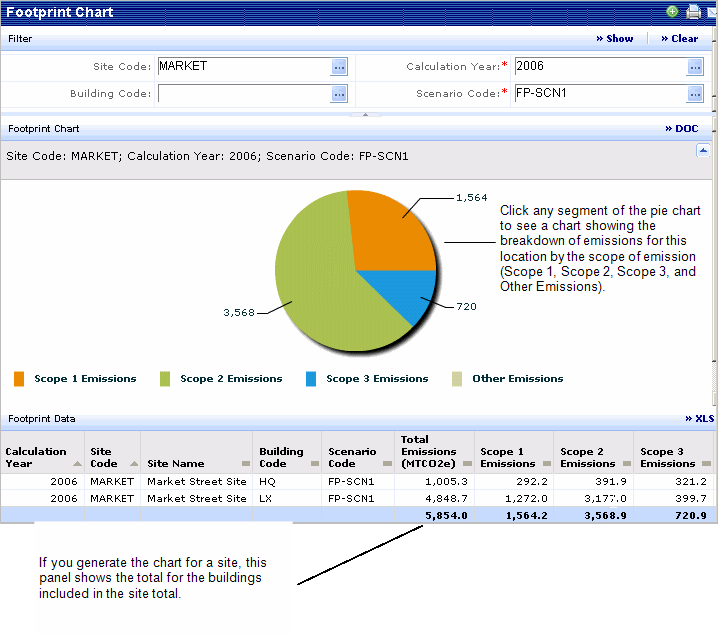
- If you filter the report to show a specific site, the Footprint Data panel below the chart shows the breakdown of emissions for each scope by building, and the total emissions for the site. If you generate the report for a single building the Footprint Data panel shows the building's total emissions.
- You can generate the chart as a paginated report (DOCX file) using the Report button.
- You can export the data in the Footprint Details panel to Excel using the XLS button.
Filtering the Reports
For both the Footprint Summary and the Footprint Summary Chart, you must select a single Site or Building, and a Scenario Code, and Calculation Year. From the Filter console, the Site Code or Building Code lists include an entry for each calculation year and footprint scenario available for the building or site, so when you select a building or a site you are also selecting a calculation year and scenario. Selecting a site or building first enables you to enter all the required filter data with a single selection.
Drilling Down in the Footprint Summary Chart
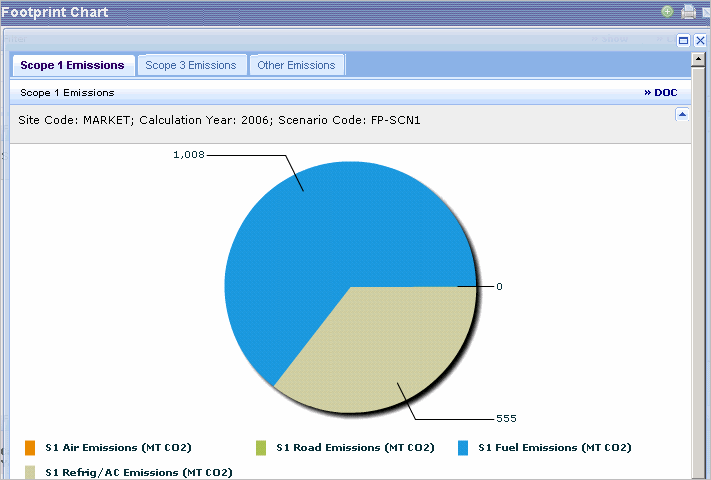
The Footprint Summary Chart presents a pie chart showing the breakdown of emissions by scope for the selected site or building, calculation year, and footprint scenario. Clicking on any part of the chart presents a drilldown chart showing the source data included in that total. For example, for scope 1 emissions, this drilldown chart could show the on-site stationary combustion and the refrigeration and air-conditioning amounts.
The following image shows the high-level chart showing total emissions by scope for the site:

The following image shows the drill-down chart. If you click on a tab, you will see the chart that shows emissions for that Scope.


