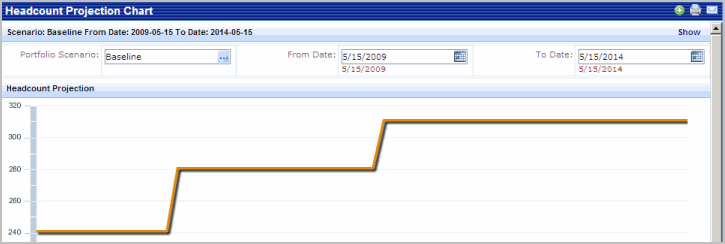
The Headcount Projection chart uses the Employee Headcount data for each group in the Portfolio Scenario, and projects it through a selected time period. You can change the scenario and time frame for the chart. Click Show to generate the chart using your selections.
The below image shows the Headcount Projection Chart:

| Copyright © 1984-2014, ARCHIBUS, Inc. All rights reserved. |