The Cost Analysis Dashboard is used by maintenance and financial personnel to analyze the historical maintenance costs of building operations.
The Cost Analysis Dashboard summarizes the following costs for your closed work.
Filtering: You can use the Filter to generate the reports shown on the dashboard for a particular year (calendar or fiscal), equipment standards, problem type, or type of work (on demand or preventive maintenance.)
These reports are used by maintenance and financial personnel to analyze the historical maintenance costs of the site.
These reports answer such questions as: What are the primary drivers of maintenance costs? How do buildings compare in maintenance costs? Which buildings are trending higher? What are the historical equipment costs and how are they trending?
This report enables you to see summarized costs for a year by location, and to drill down to analyze the costs. If you are managing the work for more than one building, this report provides a convenient way to compare their costs.
This report shows the average cost for each building as a bar chart. Click on a bar to see details for the work requests contributing to the total. These details include the location, date the work was completed, the division, department, and the total cost for each work request for that building.
This report enables you to see how costs are trending for a selected year. This report is a line chart showing the average maintenance costs of the area for the selected year. Mouse over the line at the beginning of a month and a tool tip shows you the cost at that point in time.
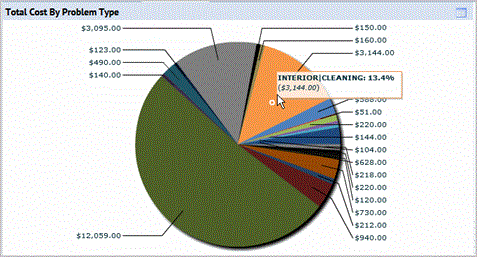
Select the Cost Details tab on the Cost Analysis Dashboard to see the Total Costs by Problem Type report. This report is a pie chart that shows the breakdown of costs by each problem type. Mouse over a section of the pie to see its problem type and cost.
This report helps you analyze the primary drivers of maintenance costs.

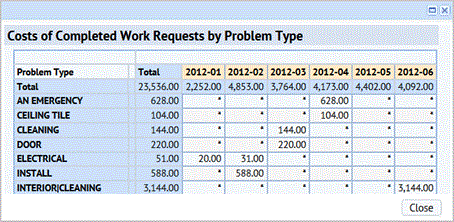
Select the Cost Details tab to see the Costs of Completed Work Requests by Problem Type. This report shows a line graph with a line for each problem type for the selected year. Mouse over a line and a tool tip shows you the problem type and summarized cost for that point in the time line. Click the Maximize button to open the line graph in a larger window. This report helps you analyze the primary drivers of maintenance costs.

Click the Report button![]() to see a table view that breaks down the costs by problem type for each month for the year selected in the Filter.
to see a table view that breaks down the costs by problem type for each month for the year selected in the Filter.

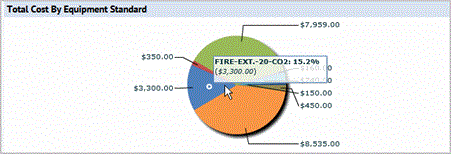
Select the Cost Details tab to see the Total Costs by Equipment Standard report. This report is a pie chart showing the costs for each equipment standard for the selected year. Mouse over a section of the pie chart and a tool tip shows the equipment standard and its associated costs for the year selected for the report in the Filter. This report answers the questions: Which types of equipment are driving your maintenance costs?

Select the Cost Details tab to see the Equipment History by Equipment Standard report. This report is a line chart showing the cost of completed work for the selected year by the type of equipment (its standard). Mouse over a section of the line and a tool tip shows the equipment standard and its cost for that point in the time line. Click the Report button ![]() to generate this report as a table showing the cost amounts for each month. Click the Maximize button to open the chart in a larger window.
to generate this report as a table showing the cost amounts for each month. Click the Maximize button to open the chart in a larger window.
This report answers the question: How are your maintenance costs for different types of equipment trending?

| Copyright © 1984-2014, ARCHIBUS, Inc. Todos los derechos reservados. |