This type of bucket charts data from an ARCHIBUS datasource within a view file.
A typical bucket descriptor for a horizontal bar chart is:
<bucket
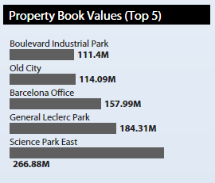
title="Property Book Values (Top 5)"
tooltip="Property book values."
type="app-specific"
controlType="horizontalBarChart"
backgroundShading="bucket-background-medium"
viewName="ab-chart-bar-sorted.axvw"
dataSourceId="chartBar_sorted_desc_ds"
valueField="property.value_book"
labelField="property.name"
abbreviateValues="true"
recordLimit="5"
valueOnTop="smallest"
/>
type. A value of "app-specific" indicates that this bucket is a separate plug-in control that extends the core ARCHIBUS navigation page functionality.controlType. A value of "horizontalBarChart" specifies that the navigation page should invoke the horizontal bar chart control with the other attributes listed as parameters.viewName. The name of the view file holding the datasource to chart.dataSourceId. The name of that datasource within that view to chart. You will typically set the datasource sort order on the numeric value and explicitly set whether this data is an ascending source or descending sort. In this way, you can get the most meaningful data for a report of outliers (e.g. a"Top 5" or "Bottom 5" report).valueField. The field within the datasource that holds the numeric data for the chart. labelField. The field within the datasource that holds the labels for the chart.abbreviateValues. Whether the chart should display the full value (e.g. 1,303,021) or abbreviate it (e.g. 1.3M).recordLimit. The number of records of data to display. This should be appropriate for the height of the row of the bucket.valueOnTop. (largest|smallest). The sort order within the datasource selects whether the chart presents the set of topmost or the set of bottommost records in the datasource. This valueOnTop parameter controls how the control presents this set of data in the chart; that is, starting with the largest value at the top of the chart, or the smallest value at the top of the chart. That is to say, the sort order within the datasource controls which records the chart includes, while valueOnTop controls how the chart displays those records. The default is to display the largest value on top.
| Copyright © 1984-2014, ARCHIBUS, Inc. All rights reserved. |