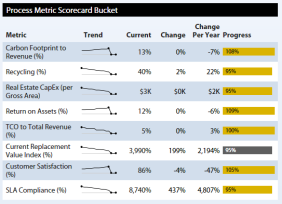
This type of bucket charts presents all of the ARCHIBUS metrics assigned to a particular scorecard. These metrics must be "Displayed" rather than "Hidden" on the ARCHIBUS Metric Scorecard Assignments (afm_metric_scards) record to display.
A typical bucket descriptor for a process metric scorecard is:
<bucket
title="Process Metric Scorecard Bucket"
tooltip="Key-performance indicators."
type="app-specific"
controlType="processMetrics"
columnSpan="2"
scorecard="BALANCED_SCORECARD"
granularity="all"
useStoplightColors="true"
/>
controlType. A value of processMetrics specifies that the navigation page should invoke the process metric scorecard control with the other attributes listed as parameters.columnSpan. Instructs the page navigation to let this control span two columns.scorecard. The Scorecard Code (afm_metric_scards.scorecard_code) assigned to all the metrics that should be displayed.granularity. The ARCHIBUS Metrics Framework collects metrics at different levels of granularity, e.g. all for portfolio wide, bu_id for Business Unit, etc. This attribute instructs the control to display a different level of granularity. For instance, if you had a virtual-private ARCHIBUS restriction on Business Unit, and you set the granularity to Business Unit, then each business unit manager would see only the process metric values for their own business unit.useStoplightColors. If true, the control will display the progress bar as green if the metric is within its target boundaries, yellow if the metric is over its warning limits, and red if the metric is over its critical limits. If false the bars display in dark grey.
| Copyright © 1984-2014, ARCHIBUS, Inc. All rights reserved. |