To reduce congestion in drawings that contain numerous symbols, HTML drawing control clusters symbols that become too near each other as you zoom out. Cluster typically group HTML markers.
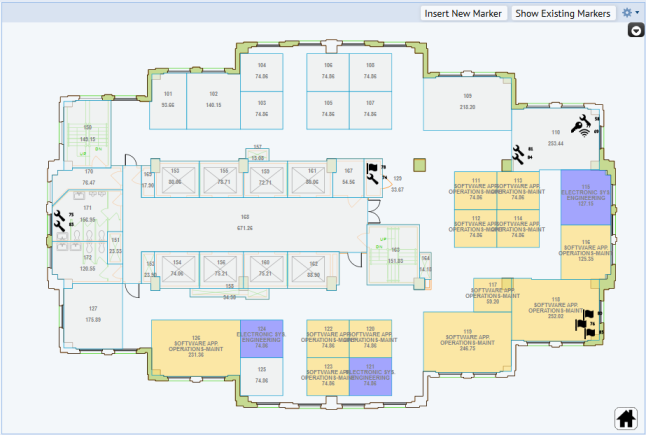
The floor plan below contains no symbol clusters. Symbols display individually, and may overlap each other, or become hard to distinguish.
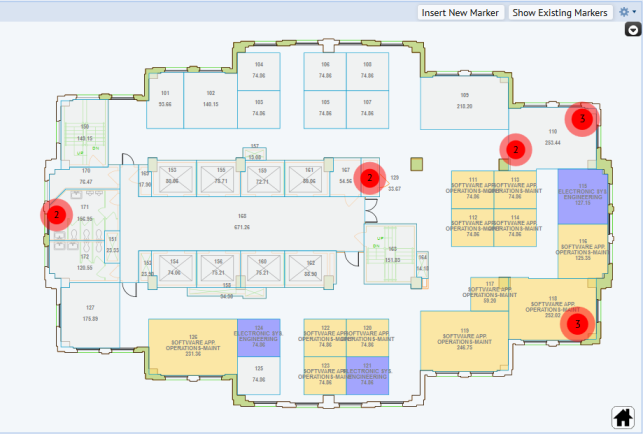
Below is the same floor plan, with symbol cluster. Symbols near each other form a cluster, represented by a red circle. The number inside the circle indicates how many marker symbols it represents. Click a cluster circle to view details for the clustered markers. If you zoom into an area, you see more details, as larger clusters disaggregate to form smaller clusters. Similarly, smaller clusters separate into individual markers. When you zoom out, the drawing presents a summary view, as smaller clusters consolidate to form larger clusters.
Like the Marker control, the Cluster control does not inherit from HTML Drawing Control. Rather, it is an add-on control that is used in conjunction with the HTML Drawing control and the Marker control. The Cluster control plugs into the HTML Drawing control and works with symbols from the Marker control as an add-on.
The following view demonstrates clustering:
Advanced drawing control
Include the necessary libraries and files for the Cluster control. In Web Central, you can include one file (ab-common-controls-cluster.axvw), which in turn includes all resources that are specific to the Cluster control.
<panel type="view" id="clusterFiles" file="cluster-common-controls.axvw"/>
To enable clustering in drawings, use the cluster parameter to pass in the cluster object. In this object, you can:
For example:
…. // define parameters to be used by server-side job var parameters = new Ab.view.ConfigObject(); parameters['divId'] = "svgDiv"; // enable add-ons parameters['addOnsConfig'] = { 'NavigationToolbar': { 'divId': 'drawingDiv'}, 'LayersPopup': { 'divId': 'drawingDiv' }, 'AssetLocator': { 'divId': 'drawingDiv' }, 'Marker': { 'divId': 'drawingDiv' }, 'Cluster': { 'divId': 'drawingDiv', 'layerName' : this.layerName, 'clickHandler' : this.onClickCluster, 'minDistance': function(scale) { return 25 * 25 / (scale * scale); } } }; this.drawingControl = new Drawing.DrawingControl("drawingDiv", "drawingPanel", parameters); this.loadSvg(this.bl_id, this.fl_id, this.dwgname); ….
You can use the drawingControl's getAddOn() API to access the Cluster add-on:
this.clusterControl = this.drawingControl.getAddOn('Cluster');
These are the properties available in the Cluster add-on object.
| Property | Example | Comments |
|---|---|---|
| divId | 'drawingDiv' | Name of the div id. |
| layerName | ‘eq-assets’ | Name of the layer to cluster |
| clickHandler | this.onClickCluster | Click handler for a cluster |
| minDistance |
function(scale) { return 25 * 25 / (scale * scale); } |
Minimum distance based on current scale. Squared, since we are using Euclidean squared distance. Anything closer than this distance is clustered. |
| distance |
function (a, b) { var dx = a.x - b.x, dy = a.y - b.y; return dx * dx + dy * dy; } |
Cluster similarity metric: Euclidean squared distance |
| clampScale |
function(min, max, s) { return s < min ? min / s : s > max ? max / s : 1; } |
Allow scaling within a range, otherwise clamp to one end of the range. |
| minClampScale | 0.25 Minimum clamp scale. | Can be used to control the number of clusters. |
| maxClampScale | 0.75 Maximum clamp scale. | Can be used to control the number of clusters. |
| fontSize | [12, 20] | Font size of the clusters. Specified as a range. |
| radius | [10.5, 20.5] | Radius of the cluster circle. Specified as a range. |
Below are some helper APIs that may be useful when working with the clustering.
if (this.clusterControl) {
this.clusterControl.recluster();
}
showLayers() api to refresh the layer list. Note that even though the clusters are technically on a separate layer, you can still toggle on/off both the clustered circles as well as the individual unclustered marker symbols, via the eq-assets checkbox.| Copyright © 1984-2018, ARCHIBUS, Inc. All rights reserved. |