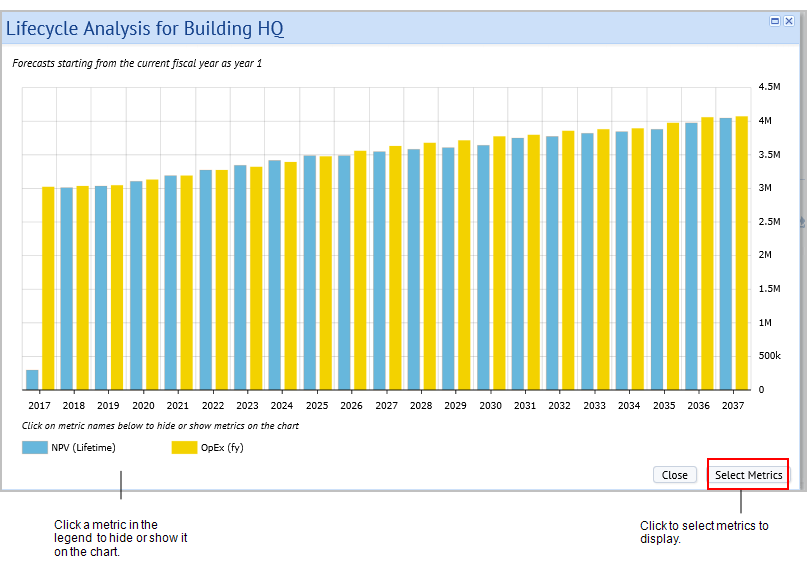
The Lifecycle Analysis Chart shows the projected costs and returns over the planned lifetime of the asset. This view shows the values in the Lifecycle Financial Analysis Summary Table (finanal_sum_life) table for the selected building in a standard HTML5 bar chart.
The chart shows a forecast starting from the current fiscal year as year 1. By default, it includes:
You can use the Select Metrics action button to select additional metrics to show. See Selecting Metrics.
To refine your analysis, you can hide and show metrics in the chart by clicking on them in the legend.
| Copyright © 1984-2016, ARCHIBUS, Inc. All rights reserved. |