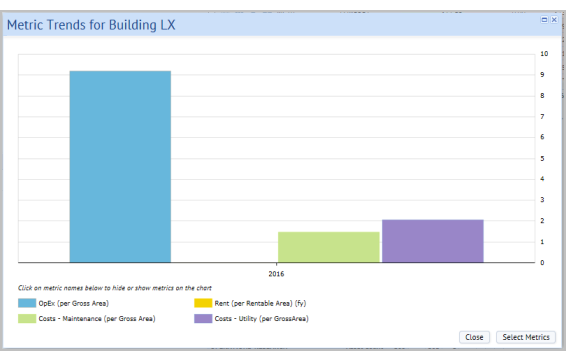
The Metric Trends chart shows change over time for selected metrics, such as Total OpEx, rent, maintenance, or utility costs. It can also show the change over time of physical metrics, such as vacancy. Multiple metrics are presented side-by-side.Generating this chart enables you to review metrics that look questionable, so you can determine if the anomaly is getting better or worse. The chart is restricted to show six years of data: three years back, and three years projected forward, if this data is available. The chart is sorted by fiscal year ascending.
You can select up to 5 metrics to show. See Selecting Metrics.
You can click on a metric in the legend to hide or show it in the chart. This enables you to hide or show metrics with greatly different scales, such as NPV and IRR.
| Copyright © 1984-2016, ARCHIBUS, Inc. All rights reserved. |