- From Web Central, select System Administration / ARCHIBUS System Administration / Add-In Manager / Define Analysis Metrics.
- From the Smart Client, select Real Estate Portfolio Management / Strategic Financial Analysis / Financial Analysis / Define Analysis Metrics task (under the Add-In Manager heading.)
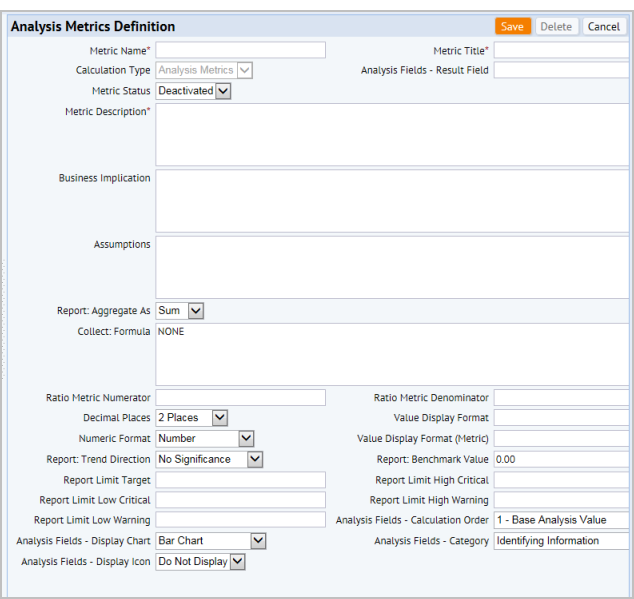
The Define Analysis Metrics form appears. The Analysis Metrics panel shows all the metrics that have already been defined
The Analysis Metric Definition form appears.
| Multi-Line Heading | Field Name | Description | Examples |
|---|---|---|---|
| Metric Name | metric_name | A unique name for the metric. Use this field to enter the corresponding table name and fields name from the finanal_sum and finanal_sum_life tables using the following convention:.
table_name.field_name Where: table_name is either finanal_sum or finanal_sum_life field_name is one of the columns in those two tables. | finanal_sum.leased_owned_percent finanal_sum.total_occupancy_cost_perSeat |
| Metric Title | metric_title | A relevant title describing the metric. The title identifies the metric to those working with the metric in the Financial Analysis Console. | Leased / Owned (%) Total Net Worth Total Occupancy Cost per Seat Total Ownership Cost per Area |
| Metric Description | description | Detailed business description of the metric, containing the purpose of the metric and information helpful for understanding the metric’s calculation. This field is not shown in the Financial Analysis Console. | For example, IRR (3 yr.) might be described as "The internal rate of return for the asset, given all expenses and income over the first three years or the entire lifetime." |
| Multi-Line Heading | Field Name | Description | Example / Comments |
|---|---|---|---|
| Calculation Type | (afm_metric_definitions.calc_type) | All analysis metrics created through this view are of calc_type = 'Analysis Metrics. This distinguishes these metrics from tracking metrics. | The analysis fields used in the Financial Analysis Console, will be set to calc_type = 'A' (Analysis Fields). |
| Analysis Fields - Result Field | afm_metric_definitions.analysis_result_field | The field that stores the results of this analysis metric. Used by the Update Analysis Metrics action. | |
| Metric Status. | metric_status | The Update Analysis Metrics action processes only analysis metrics that have a Metric Status of 'Active.' | When defining a new metric, set the status to Active when you are ready to include the metric in calculations. If you do not want to use a metric, set its Status to Deactivated. |
| Business Implication | biz_implication | The business import of the metric. This text states what the metric means and what actions managers might take based on that metric's information. This field is not displayed in the Financial Analysis Console | For instance, the implication for "IRR (3 yr.) " might be: "The internal rate of return for the asset, given all expenses and income over the first three years or the entire lifetime. IRR (3 Year) presents return for the second year. IRR (Lifetime) presents return over the Planned Life of the asset." |
| Assumptions. | assumptions | Describe any requirements for using this metric accurately. This field is not displayed in the Financial Analysis Console | For example, for the IRR (3 Year) metric, the assumption is "You must have at least one positive and one negative cash flow year for the asset to calculate the rate of return." |
| Report: Aggregate As | report_aggregate_as | Determines how to aggregate this column for datasources that:
| |
| Collect: Formula | collect_formula | Supply a WFR (workflow rule) (bean) name for any analysis metric that is not a ratio metric. WFR (workflow rule) names need to be prefixed with "bean:" The formula the metrics rule should use to calculate this metric's values. Please see the discussion Collect: Formula below. | Note: To use Java Classes as workflow rules, declare them as beans. |
| Ratio Metric Numerator | ratio_metric_num | Specifies the numerator metric in a ratio metric. |
For example, cap_AnnualWorth_an_fy for the Annual Worth metric. If you specify a Ratio Metric Numerator, you must also specify a Ratio Metric Denominator. |
| Ratio Metric Denominator | ratio_metric_denom | Metric that is the denominator ( in a ratio metric. | For example, spac_bl_AreaInternalGross_an for the Annual Worth metric |
| Decimal Places | value_disp_decimals | This field specifies the rounding that the display controls should perform on values when displaying them.
| For instance, you can display "10,000,000.12" with the following rounding values:
|
Value Display Format | value_disp_format | This is a template pattern formatting the display value. | See the discussion on Display Format below. |
| Value Display Format (Metric) | value_disp_format_m | This is the template pattern the program uses for formatting the display value if your project database has metric Base-Area Units. | |
| Numeric Format. | value_disp_numeric | All metric values are of Numeric data type. This field indicate how the metrics display controls should display the metric values. | For example:
|
| Report: Trend Direction | report_trend_dir | This attribute is used for trend direction interpretation, which specifies whether an increase in this metric’s values from the last time period represents a positive or negative outcome for the organization. | Possible selections are:
When displaying stoplight colors, the Report: Trend Direction indicates whether the program compares against the "high" limits (when "Smaller is Better", the "low" limits (when "Larger is better") or both ("On Target" is better). |
| Report Benchmark Value | report_benchmark_value | Use this field to record any industry benchmark value, against which the organization can compare its performance. | For example, for the IRR (3 Year), a benchmark value could be '0.25" |
| Report Limit Target | report_limit_target | The current performance target value for the organization. | For example, for the IRR (3 Year) metric, the limit target could be 0.12 |
Report Limit High Critical and Report Limit High Warning | report_limit_high_crit and report_limit_high_warn | High critical (red) and warning (yellow) levels for the metric. | For example, for the IRR (3 Year) metric, the High Critical level could be 0.25, and the High Warning Limit could be 0.20. |
Report Limit Low Critical and Report Limit Low Warning | report_limit_low_crit report_limit_low_warn | Low critical (red) and warning (yellow) levels for the metric | For example, for the IRR (3 Year) metric, the Low Critical level could be 0.07, and the Low Warning Limit could be 0.09. |
| Analysis Fields - Calculation Order | afm_metric_definitions.analysis_calc_order | The order in which the program should calculate analysis results, so that base metrics are calculated before the other metrics that depend on them. | This field is an enumerated list with possible values of: 0;0 - Lifecycle Analysis Base Value;1;1 - Base Analysis Value;2;2 - Sum of Analysis Metrics;3;3 - Ratio of Analysis Metrics; |
| Analysis Fields - Display Chart | afm_metric_definitions.analysis_display_chart | The type chart used to display the analysis field's values in the Performance Matrix panel of the Financial Analysis Console. | This field is an enumerated list with possible values o: DONUT;Donut; PIE;Pie Chart; PIEPCT;Pie Chart - Percent; BAR;Bar Chart; BARPCT;Bar Chart - Percent |
| Analysis Fields - Display Icon | afm_metric_definitions.analysis_display_icon | The icon to use as a semi-opaque "watermark" behind any bar chart: Icons must be in the schema\ab-core\graphics\icons\analysis folder. | This fields is an enumerated list with possible values of: N;Do Not Display;C;Currency Icon; B;Building Icon;P;People Icon |
| Analysis Fields - Category | afm_metric_definitions.analysis_field_cat | The grouping of the analysis value by business scope. | This field is an enumerated list with possible values of: INFO;Identifying Information;BLDG;Building;CAP;Capital; OPER;Operating;LEAS;Lease;BENCH;Benchmark Cost Categories;OCCUP;Occupancy;SPAC;Space;ANLYS;Financial Analysis;FIN;Financing |