Knowing the weekly cost of your upcoming work as well as the total labor requirement may help you distribute work more evenly or balance out costs.
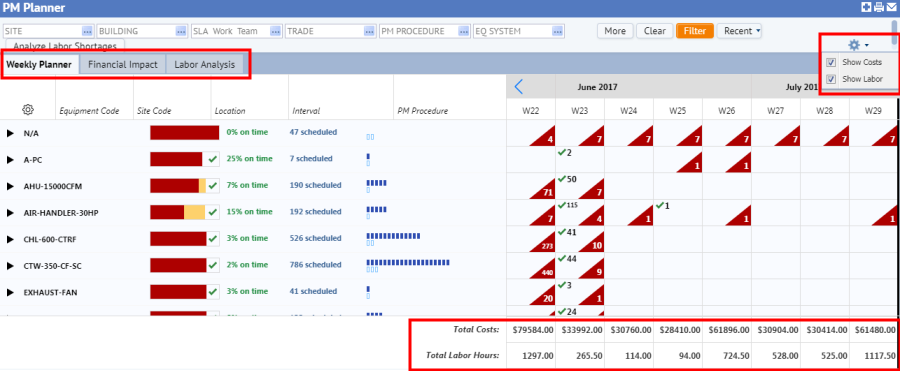
As shown in the above image, you use the gear icon to show costs and labor in the PM Planner. Check one or both of these options, and the PM Planner:
Each of these features is detailed below.
The PM Planner can include each week's total labor and total costs, as shown in the above image. Once you display these totals, the PM Planner updates these weekly costs and labor requirements if you make changes to scheduled dates, the PM Planner updates these weekly costs and labor requirements.
In order to include the Total Costs and Total Labor Hours for each week at the bottom of week column, the PM Planner view determines total labor and costs as follows:
When you select the Show Costs option, the PM Planner calculates the costs for PM Schedule Dates for the PM Schedules that meet the filter criteria. Since it is possible for a PM Schedule Grouping to have a mixture of planned and completed jobs in a single week, the costs includes both estimated and actual costs.
wo.cost_total) of the work orders for the PM Schedule Dates.Each labor hour total represents the hours of all trades that are required for the PM job. You can drill down to individual PM Schedules to see which trades are involved.
When you select the Show Labor option, the PM Planner calculates the total labor hours for all PM Schedule Dates for the PM Schedules that meet the filter criteria. Since it is possible for a PM Schedule Grouping to have a mixture of planned and completed jobs in a single week, the labor includes both estimated and actual hours.
Tip: If you want to see the labor for a single work team, enter the work team in the filter and the PM Planner shows only the PM Schedules that are handled by that work team.
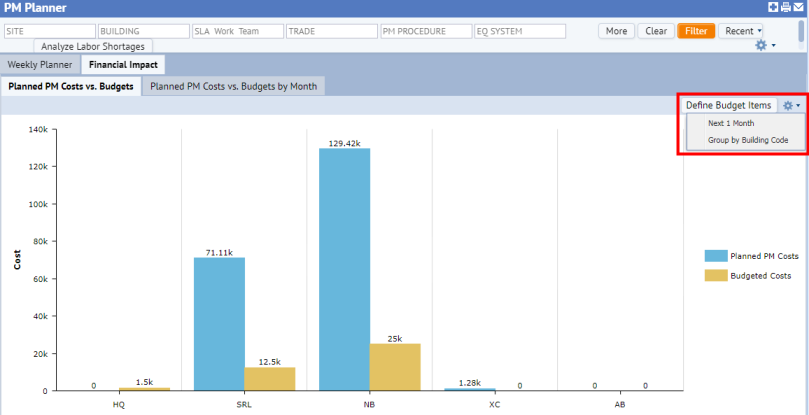
The Financial Impact tab presents two reports that compare the scheduled labor costs to budgets you have already defined. For information on developing budgets for PM work, see the Business Process Owner (Facilities) / Define Budgets task.
If you have developed budgets for corrective and preventive maintenance work, use this report to compare your budget (Budget Items with MAINT - PREVENTIVE EXPENSE) to scheduled and planned PM work. With this report, you can check the projected cost of planned work before you generate work orders; if necessary, you can reschedule items so that you meet the budget.
Use the gear icon to control the time period and how the report groups costs. For the time period, you can choose monthly increments (next month, next three months, next 12 months). For the Group By option, you can choose by Building, Account, Division, or Department. Once you make a setting, the gear menu displays your choice so that you know the time period and grouping that the chart represents. For example, in the image below, the bars represents the costs of the next month for each building.
If you need to understand the data contributing to the bar chart, click on a bar. The PM Planner presents a pop-up form listing all the PM Schedule Date records that contribute to the bar.
Rather than rescheduling work so that its cost fits within your budget, you may wish to redefine the budget. To do so, use the Define Budget Items button to access the Budget Items table and change a budget amount or create a new budget.
The Management Reports / Work Requests Budgets and Costs report is similar to this report but includes scheduled work only, this report includes scheduled work (a work order has been generated) as well as planned PM work (a work order has not been generated).
The Scheduled Work Costs vs. Budgets by Month report is similar but breaks down the data by month. For example, if you choose six months using the gear menu, the report presents six bars, one for each upcoming month.
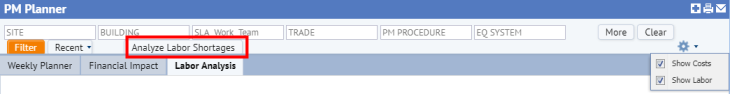
The Labor Analysis tab shows the weekly labor requirements for each trade, along with:
| Statistic | Description |
|---|---|
| Total Craftsperson Standard Hours |
The number of standard weekly labor hours for each trade. This is calculated by looking up the regular schedule of each craftsperson and getting the total hours that each craftsperson can work in each week, including any variances. These craftspersons totals are grouped by Primary Trade. These figures do not account for assigned work requests. You may wish to first filter by work team, since each PM Schedule will be routed to a specific work team, as specified in the corresponding SLA. |
| Average On Demand Hours |
Based on the Total Hours from all On Demand work requests over the last calendar year, from the current date. This is calculated from all work request labor assignments, based on a craftsperson's primary trade. All On Demand work from the last year is summed together and divided by 52 to get the weekly average; therefore the figure is the same for each week in any trade. |
| Planned PM Hours | Represents the required labor hours for each trade, as defined in either the PM Schedule or PM Procedure. |
| Remaining Available Hours |
The Remaining Available Hours is the difference between the available craftsperson hours and the total mount of hours that is projected to be required for On Demand and Preventive Maintenance work: Total Craftsperson Standard Hours minus Average On Demand Hours minus Planned PM Hours This indicates the planned PM work that requires more labor than is available. You can then switch to the Weekly Planner tab to see the specific PM Schedule Dates that contribute to the required labor hours of each week, and possibly defer or cancel some PM work in order to stay within the PM Labor capacity limits of the applicable work team. The Remaining Available Hours also indicates those weeks for which a work team has an excess of hourly capacity. |
When you enable the Labor Analysis tab, you can also run the Labor Shortage report. This report is a summary of the same information as displayed in the Labor Analysis tab, but the report shows only the weeks, trades, and work teams for which labor shortages exist (that is, Remaining PM Hours < 0) and it organizes the PM Schedules by work team. Use this report to quickly find problem areas and focus on those PM Schedules that are causing labor shortages. For example, if you see a spike in shortages, you can reschedule jobs to level out the workload.
To access this report, click the Analyze Labor Shortages button. (This button is available only after you choose the Show Labor checkbox and activate the Labor Analysis tab. It is located in the filter panel, so you can access this button no matter which tab you are in: Weekly Planner, Labor Analysis, or Financial Impact.)
In the resulting pop-up form, choose a work team. The form presents only those work teams that have labor shortages over the next 52 weeks.
The cross-tab report shows Trade Codes and Weeks, and the number of labor hours that each trade and week is over capacity.
Click on any cell in the report to filter the list of PM Schedules to that Work Team and Trade Code. The Weekly Planner and Labor Analysis tabs also jump to the selected week. This helps you to isolate those PM Schedules that are causing the labor shortage. If you click on a Trade Code, then the same filtering applies, and the Weekly Planner and Labor Analysis tabs jump to the first displayed week in the report. After making changes to the PM schedule, you can re-run the Labor Shortage report to confirm that the problem has been resolved, and move on to the next trade or work team.
| Copyright © 1984-2019, ARCHIBUS, Inc. All rights reserved. |