Real Estate Portfolio Management / Portfolio Management

Generating KPI Charts as Reports

From the maximized view for a key performance indicator chart, you can generate the chart as a report. If needed, you can apply a restriction to the chart. The restriction is used to generate the report.

To generate a chart as a report:

  1. From the Buildings, Land, Structures, or Portfolio Summary Dashboard, click the Maximize button image of the icon for the Maximize button for the chart you want to generate as a report.
  2. If you want to select a restriction for the report, from the maximized view, select the Filter buttonimage of the Filter button icon for the chart.

    The Select Filters pop-up window appears.

  3. Select a geographic, ownership, lease, or time restriction. The available restrictions depend on the chart type you select. See Filtering KPI Charts.
  4. Click Apply.

    The chart appears in the pop-up window, showing data for the selected restriction. The restriction used is indicated in the title bar.

  5. To generate the chart as a report, click the Report buttonimage of the icon for the Reports button at the top of the chart.

  6. The report appears using the same filters you selected for the chart.

    The following is an example of the report generated from the Building Area by City KPI chart:
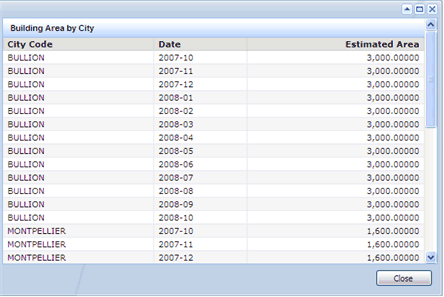
    Screen shot of a report generated from a KPI chart


Copyright © 1984-2020, Archibus, Inc. All rights reserved.