Archibus Web Central
Creating a PowerPoint Presentation from your Archibus Data
From several key views, you can generate a PowerPoint presentation based on the data shown in the view.
This enables you to quickly visualize enterprise-scale information in a concise presentation that you can take into a meeting.
You can generate a PowerPoint presentation from:
- Space Forecasting Console
- Project Proposal Console (Enterprise Assets)
- Asset Lifecycle Console (Assets and Enterprise Assets)
- Asset Disposal (Assets and Enterprise Assets)
Generating the PowerPoint presentation starts a long-running job in the same way that the system generates paginated reports. When the job completes, there is s a link to the presentation. You can continue working in Archibus while the job runs.
After generating the PowerPoint, you can delete any slides you don't need for the presentation, and make adjustments as needed, such as:
- combining images onto fewer pages
- adding titles and callouts
- using a different page size, such as 11 x 17
- moving slides to support the goals of your presentation, such as moving both the "from" and "to" plans for move tasks to the same page to be able to present to department heads where their departments will be moving from and to.
Generating PowerPoint presentations from the Space & Portfolio Planning Console
You can generate a PowerPoint presentation from the Stack Plan tab of the Space & Portfolio Planning Console using the Generate PPT action.
When working from the Stack Plan tab, the action creates one PowerPoint slide for each stack diagram for each of the buildings in the forecast that are displayed on the screen. Use the Hide and Display button next to a building / floor combination to include or exclude these locations from the PowerPoint. If a building / floor combination is not shown on the screen, it is not included in the presentation.
The slides are given the same title as the panels on the Space & Portfolio Planning Console. The panel titles include the scenario name (for example,"Stack: Allocations as of 2016-01-01"). This helps to clearly identify the data in the slide when you present it.
To have your presentation include a "before" and "after" view of the buildings, for examples, if you want to show the current allocation and an allocation using one of your forecasts, you would:
- First generate the PowerPoint for the event that represents your current inventory.
- Select the event you want to compare to the current inventory. This changes the timeline and regenerates the stack plan.
- Run the Generate PowerPoint action again to create a separate PowerPoint for this allocation.
- Manually merge the two PowerPoint presentations, arranging the slides in the order that best supports the goals of your presentation.
Generating PowerPoint Presentations from the Consoles of the Enterprise Assets Application
When working on proposed capital projects, throughout the process, you will often need to present these proposals at varying levels of detail to management and other stakeholders for their consideration.
Note: To see a floor plan in the generated PowerPoint presentation, the project must have a work package assigned, the floor plan has to have a markup, the markup must be in the doc4 field of the Action Items table (activity_log), and the Action Item record must be assigned to a Work Package
From the Asset Lifecycle or Asset Disposal Consoles
From either the Assets or Enterprise Assets applications, you can generate PowerPoint presentations from the Asset Lifecycle Console or Asset Disposal Console. The action to export to PowerPoint is found on the Projects tab in each of these consoles.
These presentations export your project data to PowerPoint so that you can use the output as the basis for a presentation. The PowerPoint button is available when you drill down to the project level from the Project tab. The Project tab shows the project drill-down list.
You might need to expand the space for the Project tab by clicking and dragging on the splitter, so that you can see the action buttons for the export.
From the Project Proposal Console (Enterprise Assets application)
When working from the Project Proposal Console, you can generate a PowerPoint based on project data from the Project Locations (Geo Locations or Project tabs), from the Gantt chart, and from the Portfolio Scenario Comparison tab.
Step when working from the Project Proposal Console:
- Select the projects from the Select Projects tab.
- Select the Project Location tab.
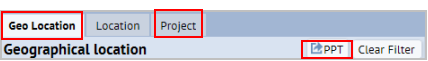
- On the Project Location tab, select either the Geo Location or Project tab
- If needed, expand the Project tab to see the PPT action button.
- At the top of the Project tab or the Geo Location tab, click PPT.
- From the Portfolio Scenario Comparison tab, select one or more scenarios to see their Gap Analysis charts. Click Print to PPT to export the charts to PowerPoint,
Working from the Gantt chart
When generating a PowerPoint from the Gantt chart, the PowerPoint includes the project schedule. You can generate a PowerPoint for the project, and then merge this presentation with the Gantt chart presentation to complete your presentation.
What is included in the PowerPoint
Tip: The presentation includes a maximum number of twenty tasks. If the list of tasks for the project is greater than twenty, you can use the Work Package field in the Filter console to limit the presentation to the work packages that are most important to include in the presentation.
When you generate a PowerPoint presentation, this action adds all PowerPoint pages relevant to the project as follows.
One page for the summary score card image. To be added to the PowerPoint, the image must be a .png, .gif, or .jpg.
One page for each floor. The program shows all tasks and all redmarks on each floor.
The order is as follows:
- Slide one -
- Title: "Project Report for: " + project.name
- Content: Project Image, Program Name, Project ID, Manager, Project Requested Start Date, Project Requested End Date, Estimated Design Cost, Affected Area
- Notes: Description, Scope
- Slide two --
- Title: "Project Summary for: " + Project Name
- Content: project.summary
- Notes: Business Case, Benefit
- Slide three ---
- Title: "Project Locations for: " + Project Name
- Content: GIS Map image
- Notes: List of bl.names for the project (from the activity_log.bl_id)
- Slide four -
- Title: "Project Evaluation for: " + Project Name
- Content: project score card
- Slide five -
- Title: "Project Schedule for: " + Project Name
- Content: Image of Gantt chart at WP level
- Slide six -
- Title: "Project Work Packages for: " + Project Name
- Content: List of Work Packages work_pkgs.work_pkg_id, Estimated Start Date, Estimated End Date
- Notes: work_pkg_id, Summary, Description
- Slide seven +
One page for each action in the current work package.- If you want to rearrange the action images -- for instance to show moves coming from two floors and consolidating into one -- you can move the images within PowerPoint.
- Some planners use a tabloid (e.g. 11x17 or A3 sized) PowerPoint format to more easily show multiple detailed images per page when printed.
Redlines. For each task (activity_log record) of the project, the application extracts the first document field (activity_log.doc1) to a bitmap file, if it is a bitmap (the redlines feature stores redline tasks as bitmaps), and adds that bitmap file as the next slide. The planner can then move and combine these images to show where key tasks are taking place, or to show "from" and "to" plans for moving departments.
- Title: "Project Actions for: " + Project Name
- Content: Work Package ID (first line)
- Action Title, Activity Type, Cost - Estimated Design, Date Required