The Asset Optimization Tab provides metrics for evaluating asset financial performance, asset mission support, and risk mitigation. The console facilitates answering the question: Are your enterprise assets cost effectively in the right place, at the right time, in the right condition to support the enterprise mission?
Optimization has three general categories:
The Asset Optimization Tab facilitates stakeholder optimization of their assets by providing operational, facility, and enterprise value metrics / KPIs.
Optimizing an asset's use can involve:
Optimizing facility operations and maintenance requires the following information :
To show assets in the Asset Location and Asset Registry panes, enter a restriction in the Asset Selection Filter. When you click Filter the data that meets the restriction is shown in both these panes. You can also make a selection from the Geo Location, Location, Organization, Project, or Systems drill-down lists. You can use the drill-down lists without entering a filter to restrict the view, or you can use this list in combination with the filter you set.
Note: When you enter a criteria in the filter and click filter, this restriction is applied to the drill-down list. The drill-down list that is affected depends on the type of criteria you enter. For example, if you enter a building, then the Geo Location and Location drill-down lists are the only lists that are restricted. Note also that the assets do not show in the Asset Location and Asset Registry pane until you make a selection from the drill-down lists, or enter criteria in the filter..
The Asset Registry pane shows the asset records that meet your restriction grouped by Asset Type.
Note: To view a building on the map, it must be geocoded, that is, it must have its latitude and longitude calculated based on its address. Your business process owner can geocode buildings when the buildings are entered. See Entering Locations (Step 2: Develop Buildings.)
If you find that you need more room to review the data in the Asset Registry, you can make the following adjustments to the screen display , as needed:
If you want to view additional fields, use the gear icon to select the fields. If needed, you can hide the Financial Analysis column to give more horizontal space for the Asset Registry.
The following image shows the Optimization tab with the filter console, Process Navigator, and drill-down lists hidden. The Equipment grouping is collapsed to allow more space to review furniture records. Although this image does not show it, you could also hide the Financial Analysis column to provide more horizontal space to review the Asset Registry. To do so, you would click the dotted area on the splitter between the Financial Analysis column and the Asset Location pane.
The Financial Analysis Console shows the Asset Scorecard from the Strategic Financial Analysis application. By default, the metrics for the Unified Capital and Expense Analysis are shown. You can use the Select Metric action to select different metrics based on the type of analysis you want to perform.
The metrics are interactive with not only the filter console and the location map, but with the Financial Analysis console itself.
Note: The panel will display and the metrics are populated based on available data. Some of the metrics may not calculate if you are not using the Strategic Financial Analysis application. In this case, you might not have values for all the metrics.
Financial Analysis displays high-level metrics, like FCI. It can also display more granular metrics, such as the TCO-Workpoint, TCO-Own (per Gross Area) and OpEx (fy). These metrics enable you to evaluate assets for disposition or reuse. The Asset Scorecard uses stoplight colors and trending arrows to highlight metrics that are veering off course before they become a problem.
Once you find an anomaly or want to evaluate an asset for optimization, you might want to drill into a trend: What is operating expense (OpEx) for the asset over its lifetime? Is the trend up or down? Is the current value an anomaly or part of a continuing trend?
Depending on the metric, you might want to investigate by loading the base data on which the metric depends. If you have a license for other ARCHIBUS applications, you can use the cross links provided when you click the Open button ![]() to load one of the detailed consoles, restricted to the selected asset. One of these selections loads the full Financial Analysis Console for asset managers that want to see more metrics side-by-side.
to load one of the detailed consoles, restricted to the selected asset. One of these selections loads the full Financial Analysis Console for asset managers that want to see more metrics side-by-side.
From the Financial Analysis pane, you can:
Click here to see an image of the Financial Analysis section of the Optimization tab.
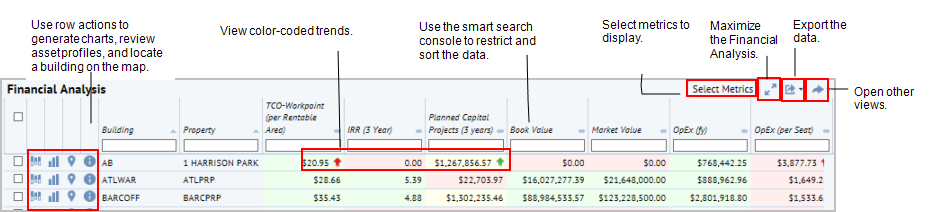
Working from the Financial Analysis pane, you can access the following: actions that enable you to generate charts, locate a building on the map, and review the asset profile
| Action Button | Description | Purpose | |
|---|---|---|---|
| Show Lifecycle Analysis |
|
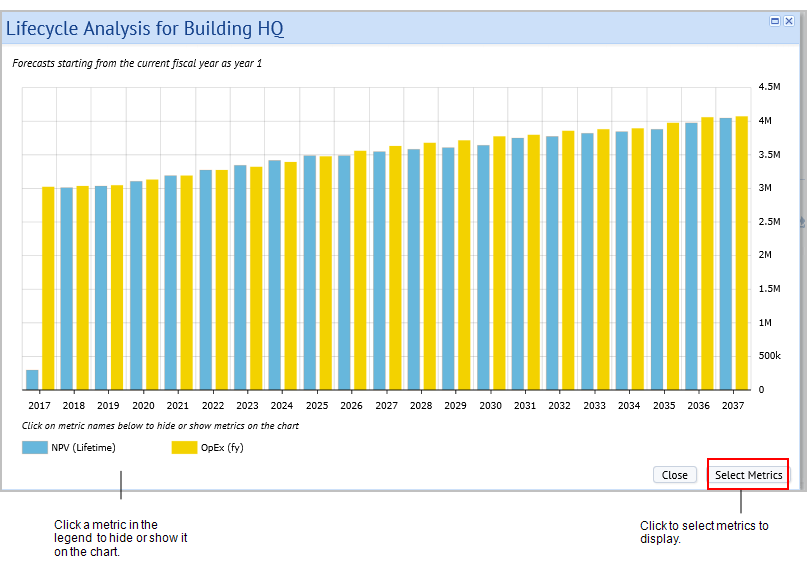
If the selected row has a building, this action shows the lifecycle analysis view in a pop-up window. The view defaults to the selected building, property, equipment, or project item. | Shows lifecycle costs for future years of the asset. That is to say, this pop up view shows how this fiscal year's costs (shown in the Performance Summary) stack up in comparison to the lifecycle cost of the asset |
| Show Metric Trends |
|
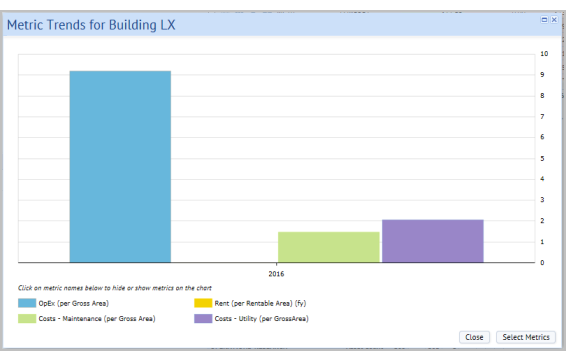
This action shows the Metric Trends chart in the pop-up window for the visible numeric fields. | Shows trends for metrics that look questionable, so the cost analyst can know if the anomaly is getting better or worse. |
|
Locate Building |

|
|
Quickly identifies the building location on the map. |
| Show Profile |
|
This action opens the building, property, or equipment profile, depending on the asset in the row from which you run the action. |
Review details for the asset. You can switch between the console and the building profile (or multiple building profiles). |
The open button ![]() loads a drop-down list of alternate ARCHIBUS applications in which to examine your data. Once you discover an anomalous set of metric values, you use these cross links to drill in to several types of data to see if the anomaly is significant, and to determine what type of action to take.
loads a drop-down list of alternate ARCHIBUS applications in which to examine your data. Once you discover an anomalous set of metric values, you use these cross links to drill in to several types of data to see if the anomaly is significant, and to determine what type of action to take.
Note: To use these links, you must have a license for the application you are linking to. If you don't, a message informs you that a license is needed.
The open button is available from the Asset Scorecard (Financial Analysis Console), or from the Financial Analysis panel o the Optimization tab (Asset Lifecycle Console.)
These alternate views open in a separate browser window, and include:
| Linked View | Description |
|---|---|
| Space Console |
Review allocations, and the divisions, departments and organizational functions that depend on that building. Select the check box for a building to open the Space Console restricted to the selected building. See The Space Console. |
| Asset Lifecycle Console |
Evaluate assets for disposition or reuse. The Asset Scorecard uses stoplight colors and trending arrows to highlight metrics that are veering off course before they become a problem. Note: This option is needed only when you are viewing the Asset Scorecard from the Financial Analysis Console. |
| Strategic Financial Analysis |
To see more metrics side-by-side, you can load the full Financial Analysis Console. Note: This option is needed only when you are viewing the Asset Scorecard from the Asset Lifecycle Console's Optimization tab. |
| Project Console |
Review project status, commitment costs, invoicing and tasks. Select the check box for a single building to open the Project Management Console restricted to projects for the selected building. See Project Management Console. |
| Lease Portfolio Console |
Review leases, tenants, clauses, options, and lease expirations for a location. Select the check box for a single building to open the Lease Portfolio Console restricted to the selected building. See Lease Portfolio Console. |
| Cost Wizard |
Review scheduled and actual costs. Select the check box for a single building to open the Cost Wizard restricted to costs for the selected building. See Cost Wizard. |
| Cash Flow Report |
Review all projected and actual costs in a detailed breakdown by cost category and month, quarter or year. Select the check box for a single building to open the Cash Flow report restricted to the selected building. See Cash Flow Report. |
When the view opens, you can enter filter criteria to further restrict the data shown.
The Lifecycle Analysis Chart shows the projected costs and returns over the planned lifetime of the asset. This view shows the values in the Lifecycle Financial Analysis Summary Table (finanal_sum_life) table for the selected building in a standard HTML5 bar chart.
The chart shows a forecast starting from the current fiscal year as year 1. By default, it includes:
You can use the Select Metrics action button to select additional metrics to show. See Selecting Metrics.
To refine your analysis, you can hide and show metrics in the chart by clicking on them in the legend.
The Metric Trends chart shows change over time for selected metrics, such as Total OpEx, rent, maintenance, or utility costs. It can also show the change over time of physical metrics, such as vacancy. Multiple metrics are presented side-by-side.Generating this chart enables you to review metrics that look questionable, so you can determine if the anomaly is getting better or worse. The chart is restricted to show six years of data: three years back, and three years projected forward, if this data is available. The chart is sorted by fiscal year ascending.
You can select up to 5 metrics to show. See Selecting Metrics.
You can click on a metric in the legend to hide or show it in the chart. This enables you to hide or show metrics with greatly different scales, such as NPV and IRR.
The criticality value is mapped to the Criticality entered for the equipment. The Criticality field is a numeric field to document the importance of the equipment item to your enterprise's mission. This value is entered for the equipment record. For example, you may want to provide a high rating for production equipment that has an expensive down-time cost.
This report provides the distribution of equipment to departments by its criticality. Drill down to a list of records contributing to the totals to further assess details (such as, location , condition, and cost) for the equipment that is most critical to your enterprise.
To generate a PowerPoint presentation from your project data:
Note: To see a floor plan in the generated PowerPoint presentation, the project must have a work package assigned, the floor plan has to have a markup, the markup must be in the doc4 field of the Action Items table (activity_log), and the Action Item record must be assigned to a Work Package
A job runs that creates a PowerPoint presentation based on the data entered for the project.
See Generating PowerPoint presentations from the Enterprise Asset Management Consoles.
| Copyright © 1984-2016, ARCHIBUS, Inc. All rights reserved. |