Environmental & Risk Management / Energy Management / Energy Manager

Meter Analytics by Location

As the Energy Manager, you can generate the Meter Analytics by Location report, a summary report that enables you to compare reported energy consumption or demand for multiple locations, and identify outliers, that is, those locations that report unusually high consumption totals for a given time / date range. The outliers become candidates for further investigation and possible optimization of location and facility remediation programs. Electric demand values are aggregated as the maximum reading for a period rather than a summation.

You can filter the report by building use and normalize by area. By combining area and use with energy consumption data, this report enables self-benchmarking.

The Meter Analytics by Location chart uses aggregated data from the BAS Data – Time Normalized Numeric table (bas_data_time_norm_num, which is created during data processing. The application now processes data for virtual meters, and saves it in the bas_data_time_norm_num table with sum or max of component meters. Processing is delayed until all component meters have been processed (for the selected month.)

Generating the Meter Analytics by Location report

To generate this report:

  1. Select the Energy Manager / Meter Analytics by Location option under Meter Analytics ont he Process Navigator or home page.
  2. The Meter Analytics by Location screen appears.
  3. Select from the following filters, and then click Show in the Filter console:
  4. Use the drill down selection list to select specific locations to report on, and click Show Selected. You can select from the country level down to the meter level.

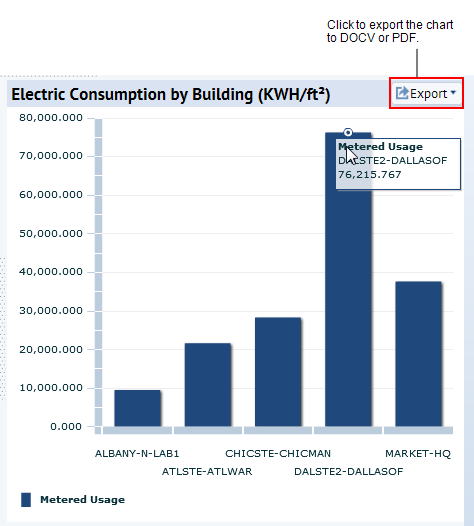
    The chart is generated using your selections.

    The x-axis displays the Location IDs by which the application groups and totals energy consumption values

    The y-axis indicates consumption in kWh or, if you select “Normalize by Area,” kWh/area (sq ft or m, depending on the project’s settings).

  5. To see the consumption value for a building, mouse over its bar.
  6. Export the chart. Export the chart to DOCX or PDF file by clicking the Export button. A message asks if you want to open the file or save it. After generating the chart as an image file, you can print the chart.


Copyright © 1984-2016, ARCHIBUS, Inc. All rights reserved.