This section overviews the concepts and essential work process for using the application.
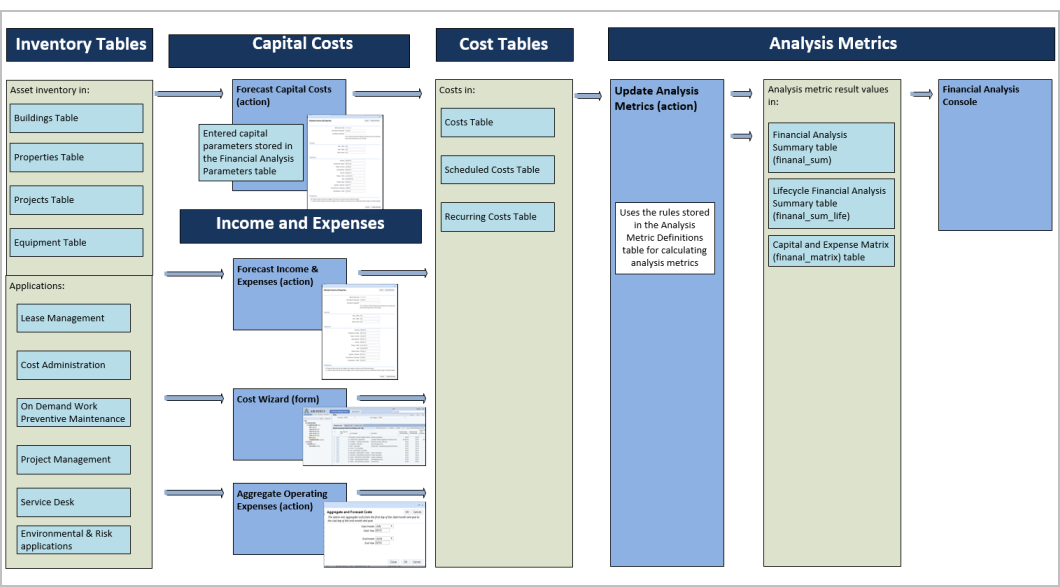
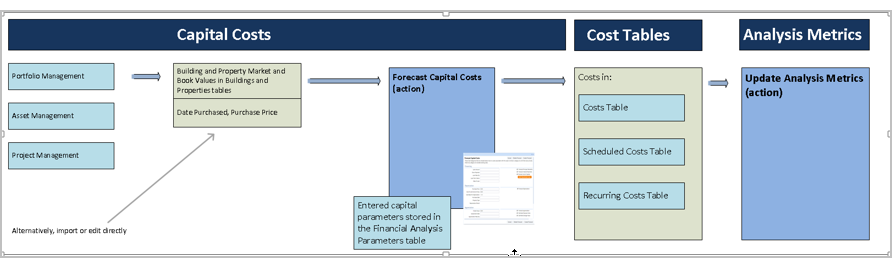
Once you have defined your background data, use the Smart Client process to define the essential asset data for Properties, Buildings, Projects and Equipment. The Strategic Financial Analysis: Process Overview topic has the specific fields you need to enter.
For each Property, Building, Project or Equipment item, run either or both of:
|
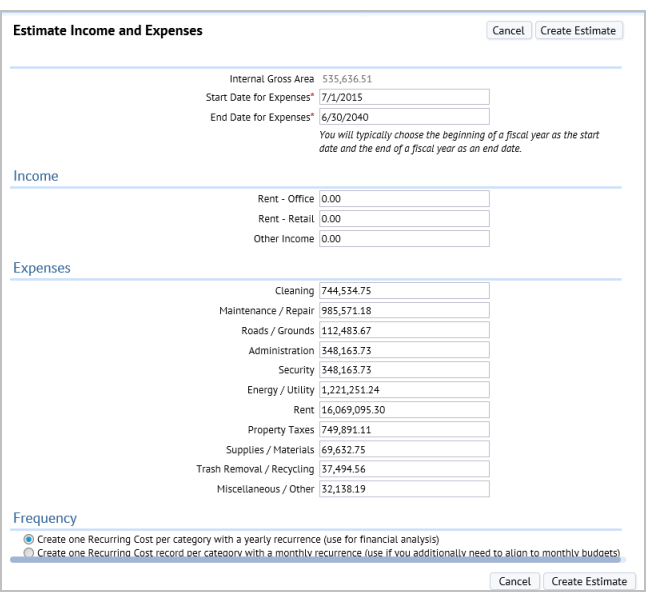
You can also use the Cost Wizard to enter costs for a property or building directly.
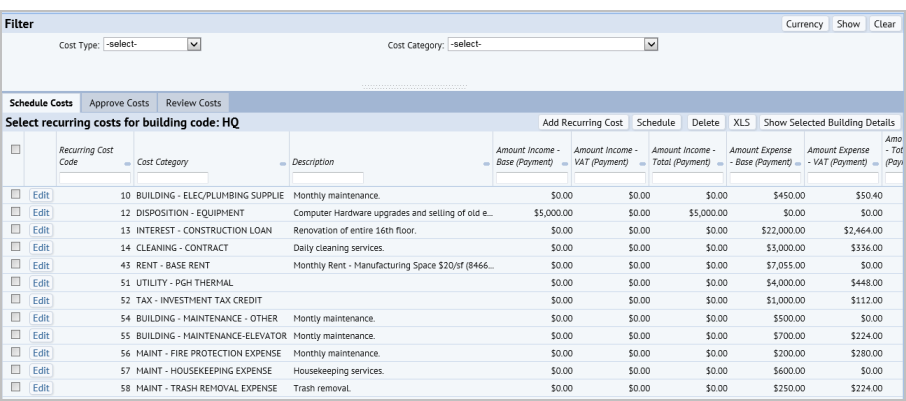
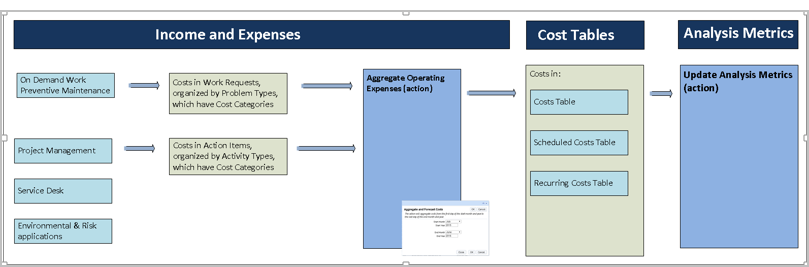
Regardless of the method you use, the application places all results in the standard Cost, Scheduled Cost, and Recurring Costs tables.
The Update Analysis Metrics action uses the rules defined in the Analysis Metrics Definitions table to calculate the resulting metrics. The action places the resulting metric values in the
The Financial Analysis Console presents the results of these analysis calculations in a way that can be filtered and displayed many different ways.
To see a larger image of the screen shots in the below diagram, click on the screen shot in the diagram and an enlarged image will appear in a popup window.
You may have developed data using another ARCHIBUS application:
In this case, when you load that asset into the Forecast Capital Costs action, any existing information – su
ch as Market Value, Date Purchased, or Purchase Price – will appear as the default the first time you use the form. You can then use the action per normal to create the cost table records that feed the analysis metrics.
To see a larger image of the screen shots in the below diagram, click on the screen shot in the diagram and an enlarged image will appear in a popup window.
You may have developed income and expense data with:
These applications place their costs in the central cost tables of ARCHIBUS. As a result, these costs will automatically be included in the analysis metrics results.
To see a larger image of the screen shots in the below diagram, click on the screen shot in the diagram and an enlarged image will appear in a popup window.
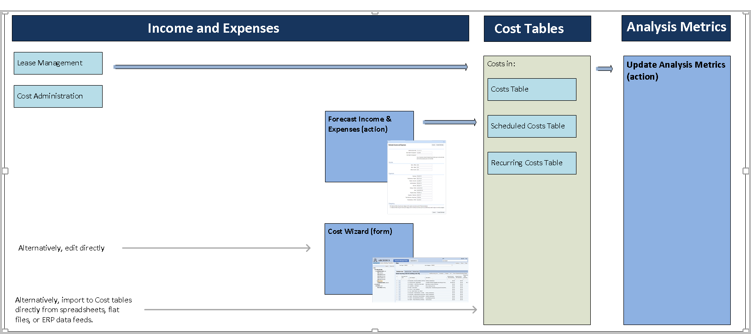
As discussed above, you can still use the Forecast Income & Expenses action to add other categories of cost that you have not developed or add estimates for other buildings or properties that you do not manage with the Lease Management or Cost Administration applications.
You have costs in other ARCHIBUS applications such as:
In this case, use the Aggregate Operating Expenses action. This action:
The analysis metrics then include these costs as it does any other costs in the cost tables.
To see a larger image of the screen shots in the below diagram, click on the screen shot in the diagram and an enlarged image will appear in a popup window.
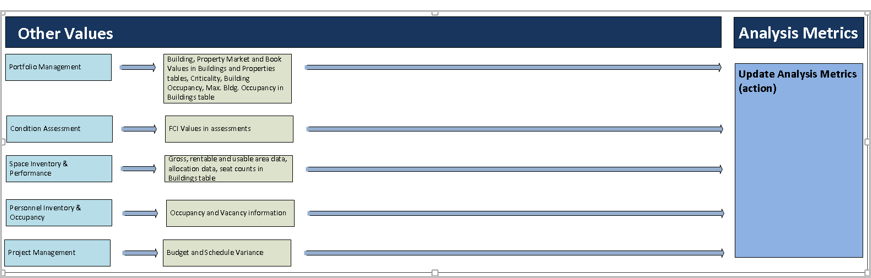
There are a number of other values that the metrics use directly if they are present. These include:
If these applications are not in use, you can enter the values directly in the Strategic Financial Analysis application via the Smart Client views. The application uses these values for analyses that depend on book value, market value, building criticality and capacity.
There are other more unique values that require companion applications if they are to be used:
You can use Strategic Financial Analysis if you do not have these applications. However, the values for FCI, vacancy, and budget and schedule variance will be zero.
To see a larger image of the screen shots in the below diagram, click on the screen shot in the diagram and an enlarged image will appear in a popup window.
| Copyright © 1984-2016, ARCHIBUS, Inc. All rights reserved. |