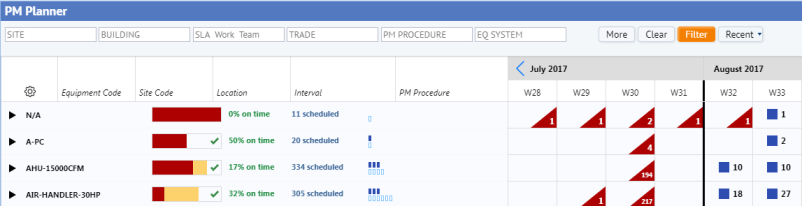
The PM Planner provides you with a graphical overview of the scheduled work as well as important statistics and counts of both your past and future work.
The left side of the PM Planner presents statistics and counts according to a time period and grouping that you specify; move horizontally across the row, and the right side (the calendar) presents weekly statistics and counts for each PM grouping. The counts and statistics presented on the left side of the PM Planner are based on a set date range of PM Schedule Dates; they are not based on the weeks that are currently displayed in the weekly calendar.
The summary information is organized according to the grouping method you specify. (For information on groupings, see Set the Display of the PM Planner: Group the PM Schedule Dates.) The PM Planner calculates and updates the statistics and bar charts whenever you change the filter or the Group By option.
Note: This topic focuses on working with PM Planner when PM Schedule Dates are summed by a grouping. For information on working with an expanded grouping, see Examine Individual PM Schedule Dates
For the recent past, you can review past jobs (PMSD.date_todo < Today) to see how timely your organization is performing the PM work in each grouping.
First, you must specify the time period that you want to consider. The counts and statistics are based on a set date range of PM Schedule Dates, and are not based on the weeks that are currently displayed in the weekly calendar.
Use the gear icon on the left side of the PM Planner to set the Past PM Schedule Dates option.
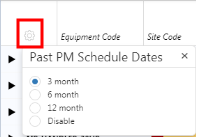
If you choose Disable, no data will appear for past statistics.
While reviewing statistics on the PM Planner, you can check the time period that the statistics represent by clicking on the gear icon. The drop-down menu shows the current setting for Past PM Schedules.
Past jobs are broken out into three categories:
Missed work is composed of two types:
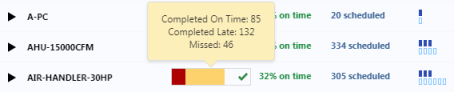
To the right of each grouping, a bar chart shows On Time, Late, and Missed work, and green text next to the bar chart displays the percentage of jobs that are on time. Hover over the bar chart for a pop-up of the details of each color.
The counts are calculated as follows:
| Count | Bar Chart Color | Calculation |
|---|---|---|
| Completed On Time | white with a green check mark |
SELECT COUNT (pmsd.pms_id) FROM pmsd WHERE date_completed <= date_latest (NOTE if date_latest is null, then compare date_completed to date_todo) Divide the above value by the total count of Past PMSD records, then multiple by 100 to get percentage. |
| Completed Late | yellow |
SELECT COUNT (pmsd.pms_id) FROM pmsd WHERE pmsd.date_completed > date_latest (NOTE if date_latest is null, then compare date_completed to date_todo) Divide the above value by the total count of Past PMSD records, then multiple by 100 to get percentage. |
|
Missed |
red |
Not Generated – PMSD where Due Date is less than today, and no WO exists SELECT COUNT (pmsd.pms_id) FROM pmsd WHERE date_latest < today and wo_id is null (NOTE if date_latest is null, then use date_todo instead) Open - PMSD where Due Date is less than today, and WO exists, but WO status is not Completed/Closed SELECT COUNT (pmsd.pms_id) FROM pmsd WHERE date_latest < today and wo_id IS NOT NULL AND date_completed IS NULL. (NOTE if date_latest is null, then use date_todo instead) Both types of missed work are added together to calculate the total percentage of missed work and generate the bar graph. You can expand the grouping to see the details of all missed jobs in the PM Schedule rows. See Examine Individual PM Schedules and PM Schedule Dates. |
Each grouping row also includes a graphical representation (blue hollow and solid blocks) of the future work, also known as scheduled work (PMSD.date_todo >= Today). For future jobs, the time frame is the visible weeks in the calendar (either 12 weeks or 16 weeks, as set with the gear icon).
There are two types of future work:
Hover over the blue blocks for a pop-up of the details of what each row of blue blocks represents.
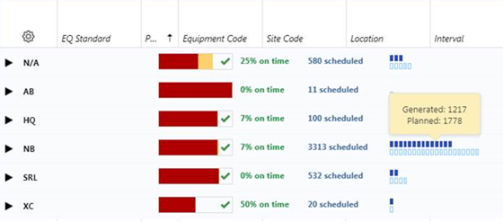
The graphic of scheduled work (the blue solid and hollow blocks) is generated dynamically, and represents the jobs in the visible time frame that are scheduled. The graphic provides a quick way of visualizing where your jobs are distributed.
The number of the blocks is relative, based on the largest grouping. For example, in the above image, grouping NB has 3313 scheduled jobs. Of those, 1778 are planned. Since 1778 is the largest of either generated or planned jobs for any grouping, it sets the scale of this graphic. All other graphics of generated and planned jobs are in relation to this the graphic for 1778 jobs.
The counts are calculated as follows:
| Count | Graphical Representation | Calculation |
|---|---|---|
| Generated | solid blue block |
SELECT COUNT (pmsd.pms_id) FROM pmsd WHERE pmsd.date_todo in date range AND pmsd.wo_id IS NOT NULL AND pmsd.date_completed IS NULL |
| Planned | hollow blue block |
SELECT COUNT (pmsd.pms_id) FROM pmsd WHERE pmsd.date_to in date range AND pmsd.wo_id IS NULL AND pmsd.date_latest >= Today |
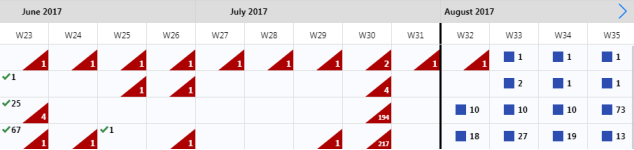
The calendar portion of the PM Planner presents, for each grouping, counts of scheduled and past jobs for each week. Past weeks display a count of completed jobs and missed jobs, while the future (and current) weeks give a count of the scheduled jobs. In the below image, the current week is week 32 and it shows missed and future jobs. Columns to the left of week 32 are past weeks showing completed and missed jobs, and columns to the right of week 32 are future weeks showing planned jobs.
| Count | Graphical Representation | Notes | Calculation |
|---|---|---|---|
|
Past Jobs - Completed |
number with a green checkmark |
Includes both jobs that were completed on time or late. |
SELECT COUNT (pmsd.pms_id) FROM pmsd WHERE date_completed IS NOT NULL AND date_completed within date range of the week |
| Past Jobs - Missed | number in a red corner |
It is important to call out missed jobs to the Maintenance Manager so that this person can take action. |
SELECT pmsd.* where pmsd.date_latest < today AND (pmsd.date_completed is NULL OR pmsd.wo_id IS NULL). If date_latest is null, then the current date will be compared to date.todo. |
| Scheduled Jobs | number, displayed next to a blue square |
Represents all the Scheduled dates for that week, whether those dates have already generated work orders or not. Provides a high-level glance at the volume of work that is scheduled for this grouping in each week. You must expand the grouping and look at the individual PM Schedule rows to see which dates have generated work orders and which do not have work orders. |
SELECT COUNT (pmsd.pms_id) FROM pmsd WHERE date_todo within date range of the week |
It is possible for a PM Schedule group to have a mixture of Completed, Scheduled, and Missed jobs. All three statuses is represented like this:

Note that a job can be scheduled for a past week but is not be considered Missed if its Date Latest is later than the current day. This only applies to job that have a generated work order. If a job's PM Date is earlier than the current day and it has no Work Order, it is considered Missed even if its Late Date is after the current day.
| Copyright © 1984-2019, ARCHIBUS, Inc. All rights reserved. |