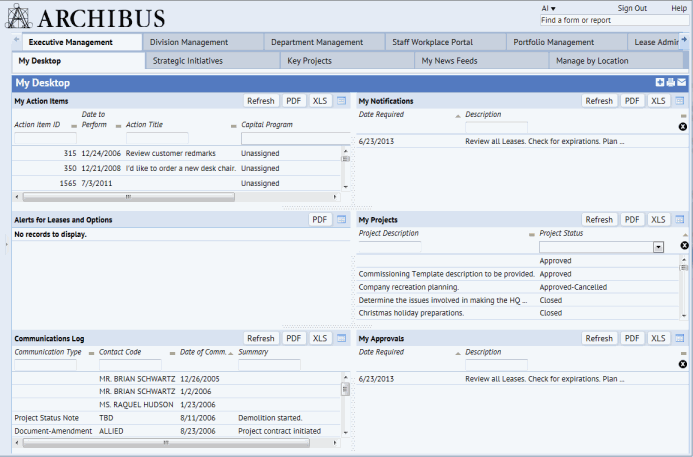
Like the Process Navigator, ARCHIBUS Home page, and My Favorites, the Dashboard is a method of accessing ARCHIBUS views into the data repository. The Dashboard uses a tabbed interface and in addition to providing access to views, it can present personalized data such as notifications, emails, web sites, and news feeds.
Dashboard tabbed navigation includes two rows of tabs. The first row presents general categories, such as an ARCHIBUS application or ARCHIBUS role (Department Manager, Executive, General Staff). Select a tab from the top row, and the second row of tabs shows the processes for this selection. Selecting a second-level tab loads the view defined for the selected process. Typically, selecting a second-row tab presents a dashboard view (which presents several views within it); however, the Dashboard can also present a single panel showing one view, such as a common data entry task.
For example, in the below image, the Executive Management tab presents a series of tabs useful to executives, including ARCHIBUS views and third-party news feeds. In this case, the user has selected the My Desktop tab which presents a dashboard view that groups notifications, alerts, and important summary views from across ARCHIBUS applications. The Executive Management's Key Projects tab, on the other hand, does not present a multiview dashboard view, but a standard ARCHIBUS report--the Projects Scorecard report.
Like the Process Navigator and home pages, the Dashboard presents tabs and tasks that are appropriate for the user's role and security settings.

You may need to horizontally scroll the Dashboard to see its complete list of tabs.
Use the arrow buttons, located at end of the row of tabs, to scroll the list of tabs.
When your My Profile/Navigation method is set to Dashboard, the system hides the Process Navigator. However, you may find that you need the Process Navigator in order to access a view not presented by the Dashboard.
You can always access the Process Navigator by clicking the triangle button on the left border of the Web Central application window. In this case, Web Central presents both the Process Navigator and the Dashboard.
When you are through with the Process Navigator, you can hide it by clicking on the dotted area of the splitter, located on the right border of the Process Navigator.
Note: The opposite behavior is not true. If your My Profile/Navigation method is set to Process Navigator, you cannot access the Dashboard.
Users with appropriate access can use the Dashboard Definition Wizard to design customized Dashboards and assign them to users. See Using the Dashboard Definition Wizard.
| Copyright © 1984-2019, ARCHIBUS, Inc. All rights reserved. |