Dashboard views present multiple views on one screen, providing easy access to key information that you need to accomplish your facilities management goals. For example, the below "Building Dashboard" dashboard view presents a series of panels, with each panel presenting its own ARCHIBUS view focusing on some aspect of building management. Each panel displays the title of the ARCHIBUS view it presents.

Dashboard views can be loaded from:
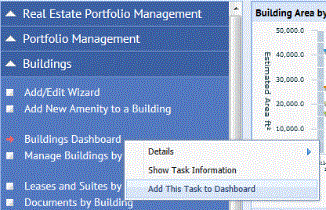
For example, you can load the Buildings Dashboard view (pictured above):
If you load the dashboard view from the Process Navigator, you may wish to hide the Process Navigator to create more screen space for the dashboard view. You can reinstate the Process Navigator with the triangular button on the left frame.
Each view included in a dashboard view has a Maximize icon  in the panel title bar. Click this button and the system replaces the dashboard panels with this view so that you see it in detail. The enlarged view includes the typical buttons for printing the view, sending the view as an email link, and so forth.
For example, in the above "Building Dashboard" view, you can click on the Maximize button of top left panel so that you can see the complete "Building Area by Facility Type" view.
Clicking the Close button closes the enlarged window, and returns you to the dashboard view.
In some cases, certain functionality, such as filtering data is only available from the maximized view. For example, from the Portfolio Administration / Buildings Dashboard, the Filter and Report buttons are available only when you maximize the chart view.
You may want to replace a dashboard view's panel with a view of your own choice. You can make this type of change by selecting the view in the Process Navigator and then dragging it onto your dashboard view.


Note: You can add only V1.0 views to dashboards that have V1.0 views, and V2.0 views to dashboards that have V2.0 views. (The reason is that the V1.0 view dashboards use iFrames while the V2.0 dashboards use a single frame divided into a layout.)
Note: When dragging and dropping views, you will get the best results with views that you have defined using the View Definition Wizard and placed on the Process Navigator. These views follow all of the conventions required for dashboard views. Views that are created by hand may not follow these conventions.
| Copyright © 1984-2019, ARCHIBUS, Inc. All rights reserved. |