Summary views (also referred to as View Analysis views) provide summary statistical data in various formats. This data may be presented as a simple one-category table, a two-category table, a bar graph, a line/area graph, or a pie chart. If the summary view has links turned on, you can drill-down to detail reports by clicking on the links. Your business process owner can use the View Definition Wizard to define these types of views and to place them on your Process Navigator. They also might be included in a dashboard view assigned to you.
Summary views also include key performance indicator charts, such as those available in the Real Property Portfolio Management's Portfolio Administration application. These charts are available as tasks from the Process Navigator, or as part of the Portfolio Administration dashboard. See Key Performance Indicator Charts: Overview.
You can add and position a legend to any chart by right-clicking on the chart and selecting one of the following from the context menu:
The context menu also has an option to remove the legend.
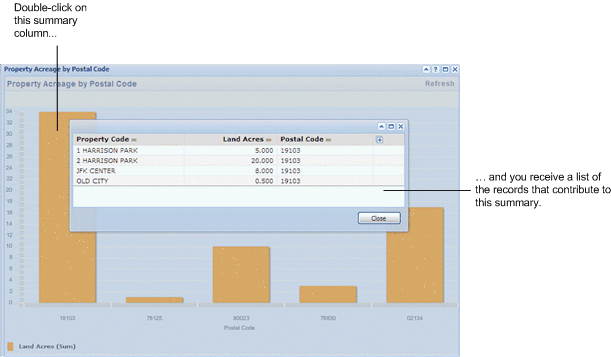
If a summary view has been created to enable drilldown, you are able to select a bar or line in the chart to see details for the records included in the bar or line you click on. For example, the bar chart in the following image totals property acreage by postal code. If you double-click on the left column, for postal code 19103, you receive a pop-up listing details for the properties that contribute to that summary.

If a key performance indicator chart is grouped by geography, you can drill down to see a chart that shows data for the next level down. For example, clicking on the bar for a state displays a chart that shows data for the cities in the state you clicked on. See Drilldown for Charts Grouped by Geography.
The simplest type of View Analysis view is a one-category view, which may be displayed as a table or chart.
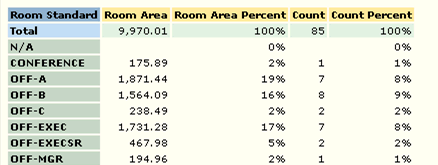
In the example below, there is one category, Room Standard, and there are four types of statistical values: Room Area, Room Area Percent, Count, and Count Percent. The category values are always displayed in the left column, and the statistical values are displayed in the subsequent columns.
Rooms by Standard Table
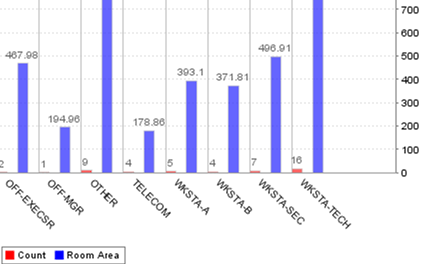
In the example below, the category is Room Standard, which is displayed along the horizontal axis. Each color-coded bar represents a statistical value. In this example, there are two types of statistical values: Count and Room Area.
Rooms
by Standard Bar Chart
The more complex type of View Analysis view is a two-category view, which may be displayed as a table or a chart.
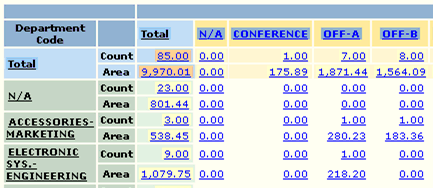
In the following example, room records are grouped according to Department Code and Room Standard, which are the two categories of the view. The two types of statistical values that are displayed are Count and Area. The first category is displayed in the left column, and the second category values are displayed as column headers. The statistical values are displayed in the table cells.
Rooms by Standard by Department Table
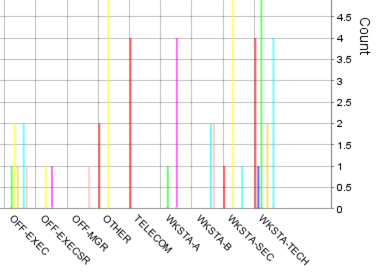
In the example below, the first category is Department Code and the second category is Room Standard. The type of statistical value that is represented is Count. The Room Standards are represented along the horizontal axis, and multiple color-coded bars display Department Code Count statistics for each Room Standard.
Rooms by
Standard by Department Bar Chart
You can drill down to details on any statistics by clicking on a linked statistical element. For example, if you click on a linked bar in a bar graph, detailed statistics on the selected data appear. You can also click on a linked cell within a table to view details for its data.
Drill-down details are displayed in a new window. You can print, move, resize, or close this detail view.
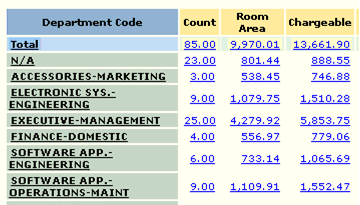
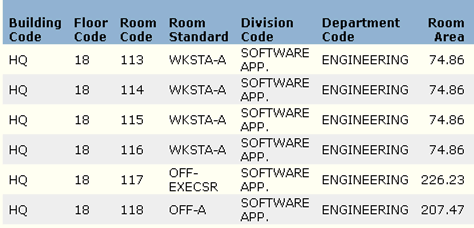
The following is an example of a detail view that appears after clicking a linked element in a Room Areas by Department view (see first view below). When the user clicks the total Room Area link for the Software App-Engineering department, a detail view for the Room Areas by Department view appears (see second view below). The detail view displays the detailed Room Area statistics for the Software App-Engineering department. These statistics appear in a new window.
View Analysis View: Room Areas by Department
View Analysis Detail View: Room Areas by Department
Note: In some cases, the links to the detail views in View Analysis views are turned off. If you are not able to access links to detail views, notify your system administrator.
| Copyright © 1984-2019, ARCHIBUS, Inc. All rights reserved. |