Archibus SaaS / Assets / IT Asset Manager / Telecom Console
Assets / Assets / IT Asset Manager / Telecom Console
Assets / Enterprise Assets / IT Asset Manager / Telecom Console
Assets / Telecom Assets / Telecom Management / Telecom Console
Show Telecom Connections on the Floor Plan (Trace Connections)
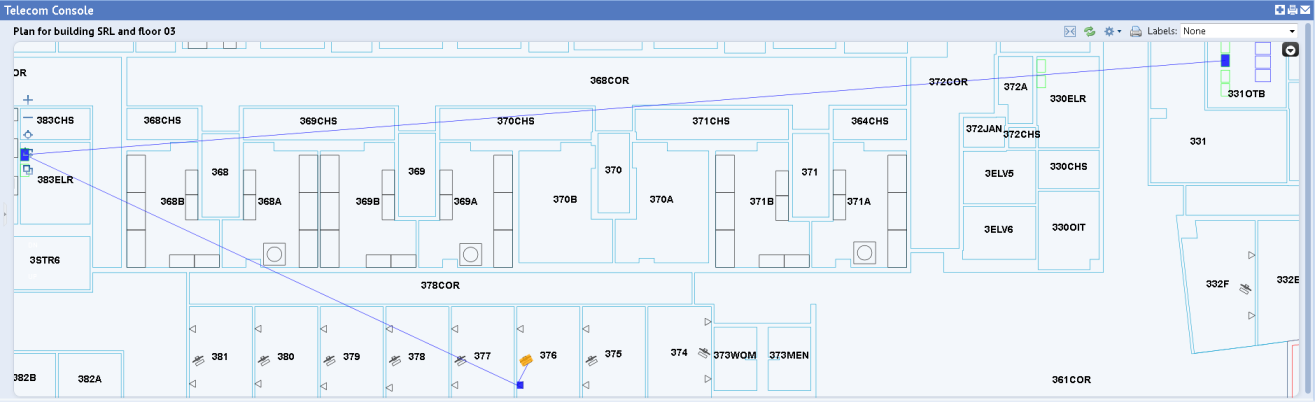
Once your connections are recorded, you can view them on the floor plan using the Telecom Console's Trace Connections command. For example, the below image shows the connection from the workstation computer, to the faceplate in room 376, to the patch panel in room 383ELR (the telecom closet), to the patch panel in room 331OTB (the equipment room).
Note: Multiple drawings are not supported for queries and graphical traces. (APP-216)
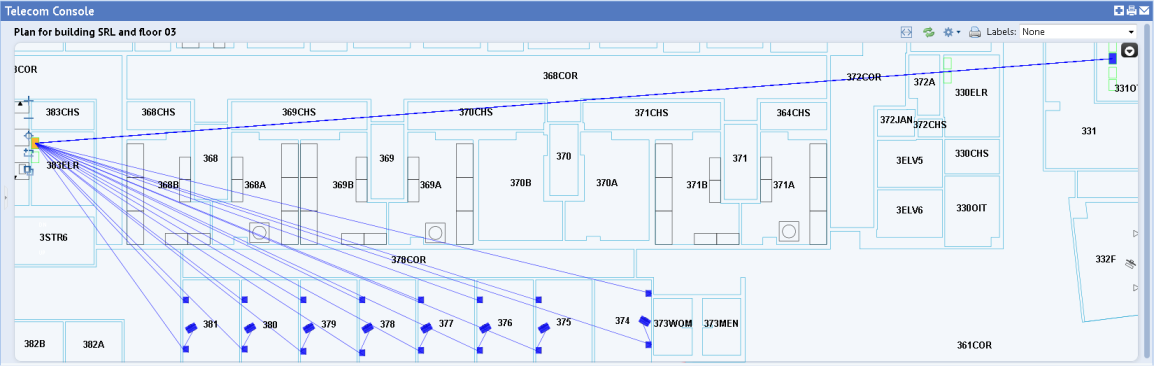
The trace can show both items toward the workstation and toward the equipment room. For example, the following image shows tracing all the ports on the patch panel in room 383ELR. The trace shows the connection to the devices in the equipment room (331OTB), as well as the connections to all the faceplates at the workstations.
The trace feature visually shows you the connections; it does not show the exact ports on equipment or patch panels or jacks on faceplates to which an item is connected. To see this level of information, you must list the telecom connections.
To trace an asset's connections:
- From the Telecom Console, right-click on the asset in the floor plan and choose Trace Connections from the pop-up menu.
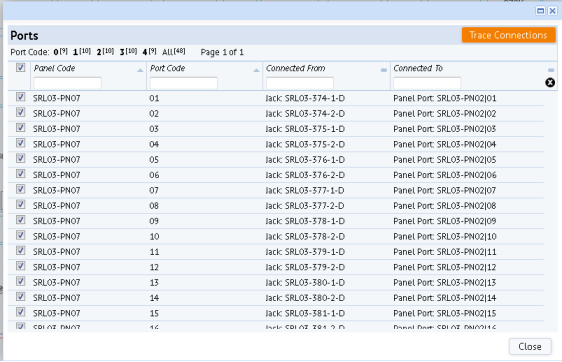
- If you have chosen an item with sub-items (such as jacks or ports), the system presents a form so you can choose one or multiple ports or jacks for which to trace connections. Select the items, and choose the form's Trace Connections button.
- For example, selecting all ports in the form (as per below image) generates the trace pictured above for SRL03-PN07 in room 302ELR.
- On the floor plan, the system draws lines between the connected devices.
- If you need information about any of the connected devices, you can hover over the highlighted asset in the floor plan, and the system displays the name of the device and its standard. If you need more information than the ID and standard, you should clear the trace and query the item.
- When through, clear the trace by selecting the Reset button in the upper right corner of the floor plan.
You can also view connected devices with these methods: