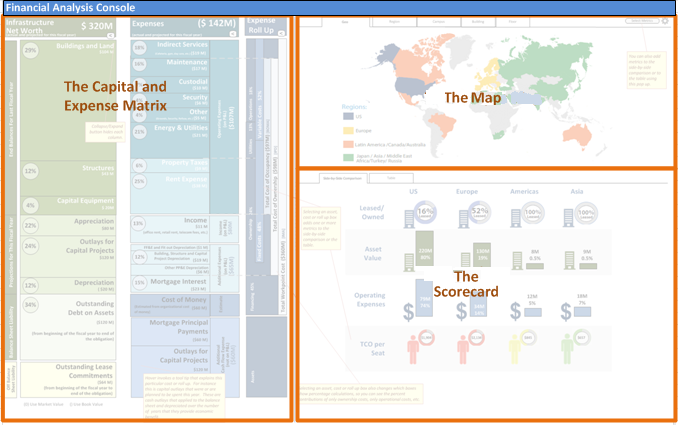
The Financial Analysis Console is divided into three sections:
This topic describes the selections you can make when working from each panel.
The Capital and Expense Matrix shows a unified view of the total costs associated with your assets. It displays an interactive matrix of this fiscal year's infrastructure costs recorded in ARCHIBUS. Use the matrix to select cost categories to display their metrics in the other panels. You can then drill down for further detail. See Capital and Expense Matrix.
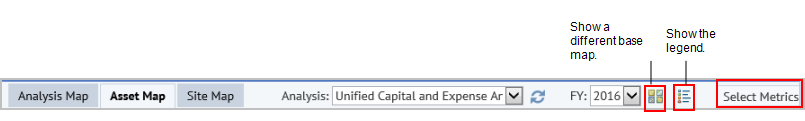
To view different maps, select one of the following tabs at the top of the map panel:
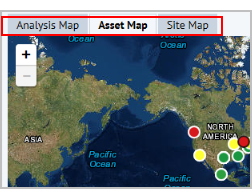

Asset Map. Shows analysis metrics of your holdings and locations. The assets are represented by markers that are color-coded by the values for the metric. You can filter the map to show analyses by geographical region or country.
Highlighting. If you have selected the tab to view the Asset Scorecard, when you mouse over a location (analysis group) on the map, the data record corresponding to that location is highlighted in the Asset Scorecard. Conversely, when you mouse over a record in the Asset Scorecard, this changes the highlight for the corresponding location. Once you select the Asset Map tab, you can select the metrics to display, toggle the base map selection, or show the legend if you have hidden it.
The scorecard panel can display either the Analysis Scorecard or the Asset Scorecard.
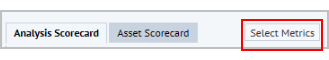
View the Analysis Scorecard.
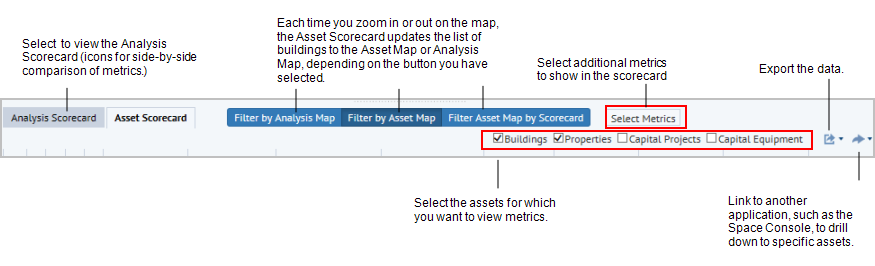
When working from the Asset Scorecard:
View the Asset Scorecard.
The console includes two map views - the Analysis Map or the Asset Map. You can zoom to any level on either map using the mouse scroll wheel or the +/- zoom buttons.
The following options affect the zoom:
If you want to zoom both the Asset Map and the Asset Scorecard to the same level, you can:
The Asset Map zooms in to display just the buildings visible in the grid.
Working from the Financial Analysis pane, you can access the following: actions that enable you to generate charts, locate a building on the map, and review the asset profile
| Action Button | Description | Purpose | |
|---|---|---|---|
| Show Lifecycle Analysis |
|
If the selected row has a building, this action shows the lifecycle analysis view in a pop-up window. The view defaults to the selected building, property, equipment, or project item. | Shows lifecycle costs for future years of the asset. That is to say, this pop up view shows how this fiscal year's costs (shown in the Performance Summary) stack up in comparison to the lifecycle cost of the asset |
| Show Metric Trends |
|
This action shows the Metric Trends chart in the pop-up window for the visible numeric fields. | Shows trends for metrics that look questionable, so the cost analyst can know if the anomaly is getting better or worse. |
|
Locate Building |

|
|
Quickly identifies the building location on the map. |
| Show Profile |
|
This action opens the building, property, or equipment profile, depending on the asset in the row from which you run the action. |
Review details for the asset. You can switch between the console and the building profile (or multiple building profiles). |
See also:
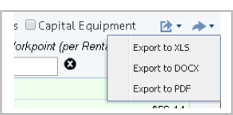
After setting a filter, you can export the Asset Scorecard results to email or to use in documents or Excel.
Click the export button at the top right of the Asset Scorecard panel
| Copyright © 1984-2016, ARCHIBUS, Inc. All rights reserved. |